
HERMANN — As reported in last week’s paper, Gov. Mike Parson and the Missouri Department of Health and Senior Services have identified two key metrics that they feel counties should use …
This item is available in full to subscribers.
We have recently launched a new and improved website. To continue reading, you will need to either log into your subscriber account, or purchase a new subscription.
If you are a current print subscriber, you can set up a free website account by clicking here.
Otherwise, click here to view your options for subscribing.
Please log in to continue |
|
.jpg)
.jpg)
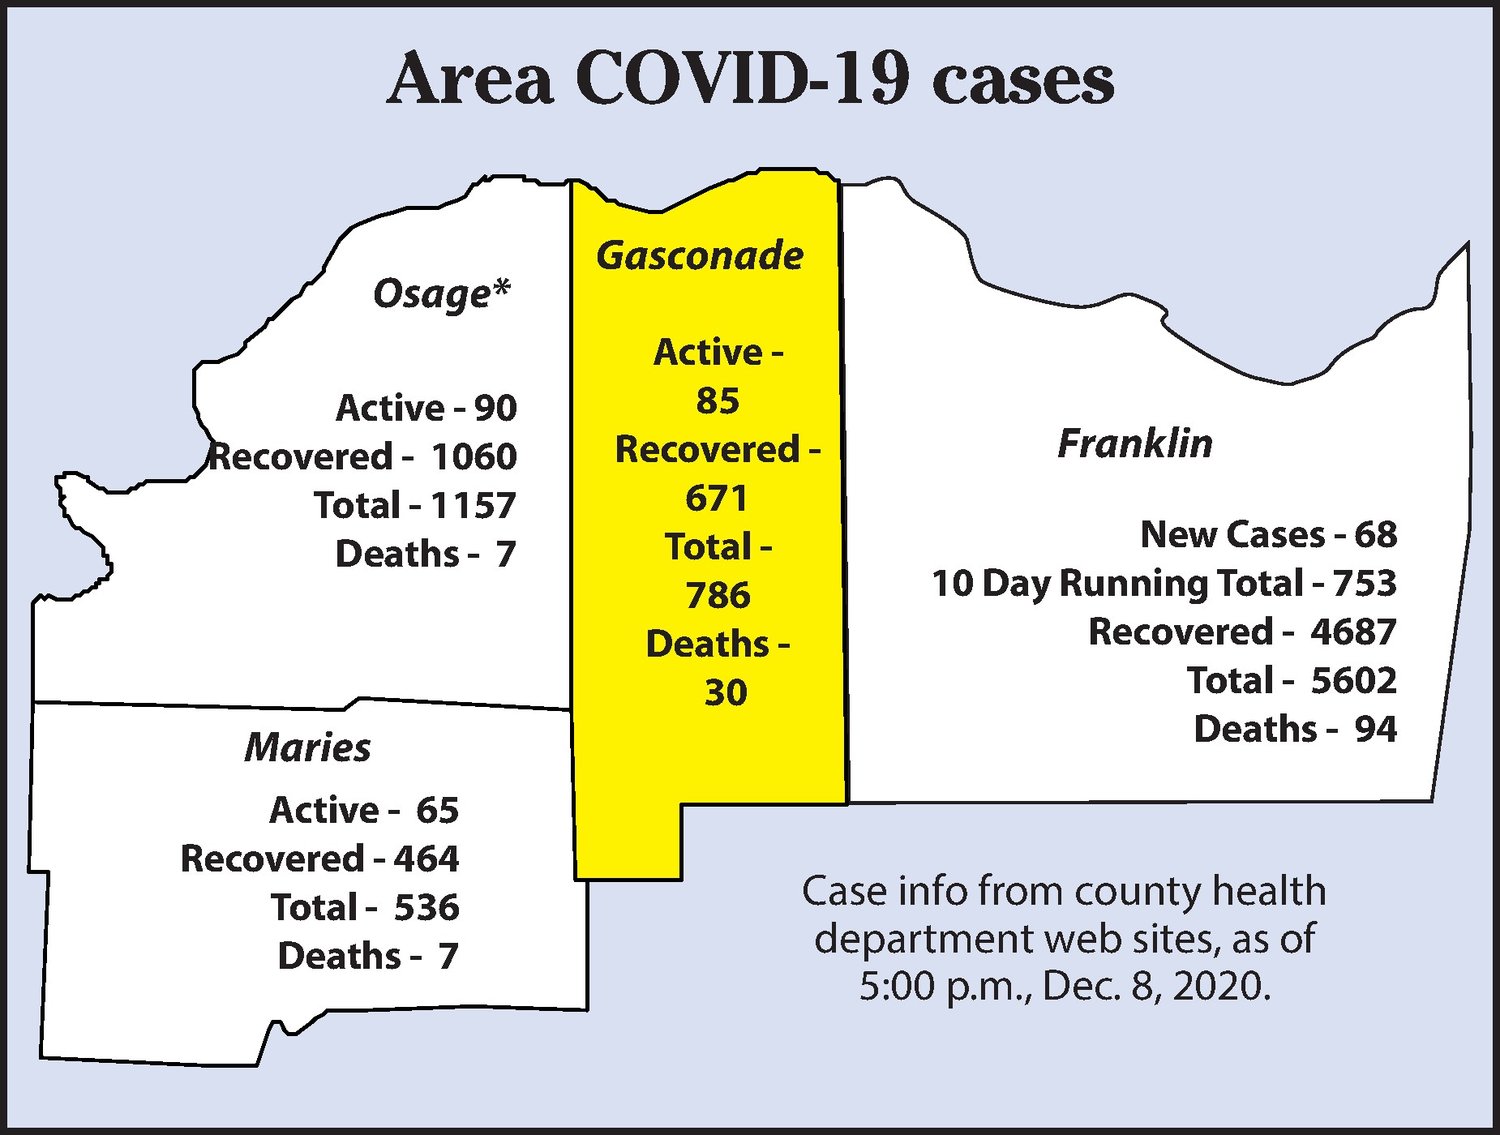
HERMANN — As reported in last week’s paper, Gov. Mike Parson and the Missouri Department of Health and Senior Services have identified two key metrics that they feel counties should use to determine the risk of COVID spread and to guide policy decisions by local officials.
This week’s data/graphs are a bit better than last week, but still very concerning.
As a reminder, this first graph, “Positivity Rate” is primarily answering the question: “are we doing enough tests?”
The numbers here are clearly trending better and we even had a day below the 10 percent “Critical Risk” threshold. In looking at the “raw” data, there is a suggestion that while our total number of tests is doing better, our testing is not evenly distributed.
In the last seven days included in this analysis, there were 671 tests, but about 250 of these appear to be weekly testing of long term care residents (assisted living/nursing home patients). If we were to remove all the tests (positive and negative) done on the day of those weekly tests, our positivity rate would be over 25 percent, which is far above the most dangerous category the governor identified.
Bottom line is that while this is a bit better, MANY more people should be getting tested during their quarantine or when they have COVID like symptoms (even mild symptoms). New CDC guidelines regarding testing during the shortened quarantines are being finalized at the Health Department and are probably already in place by date of this publication.
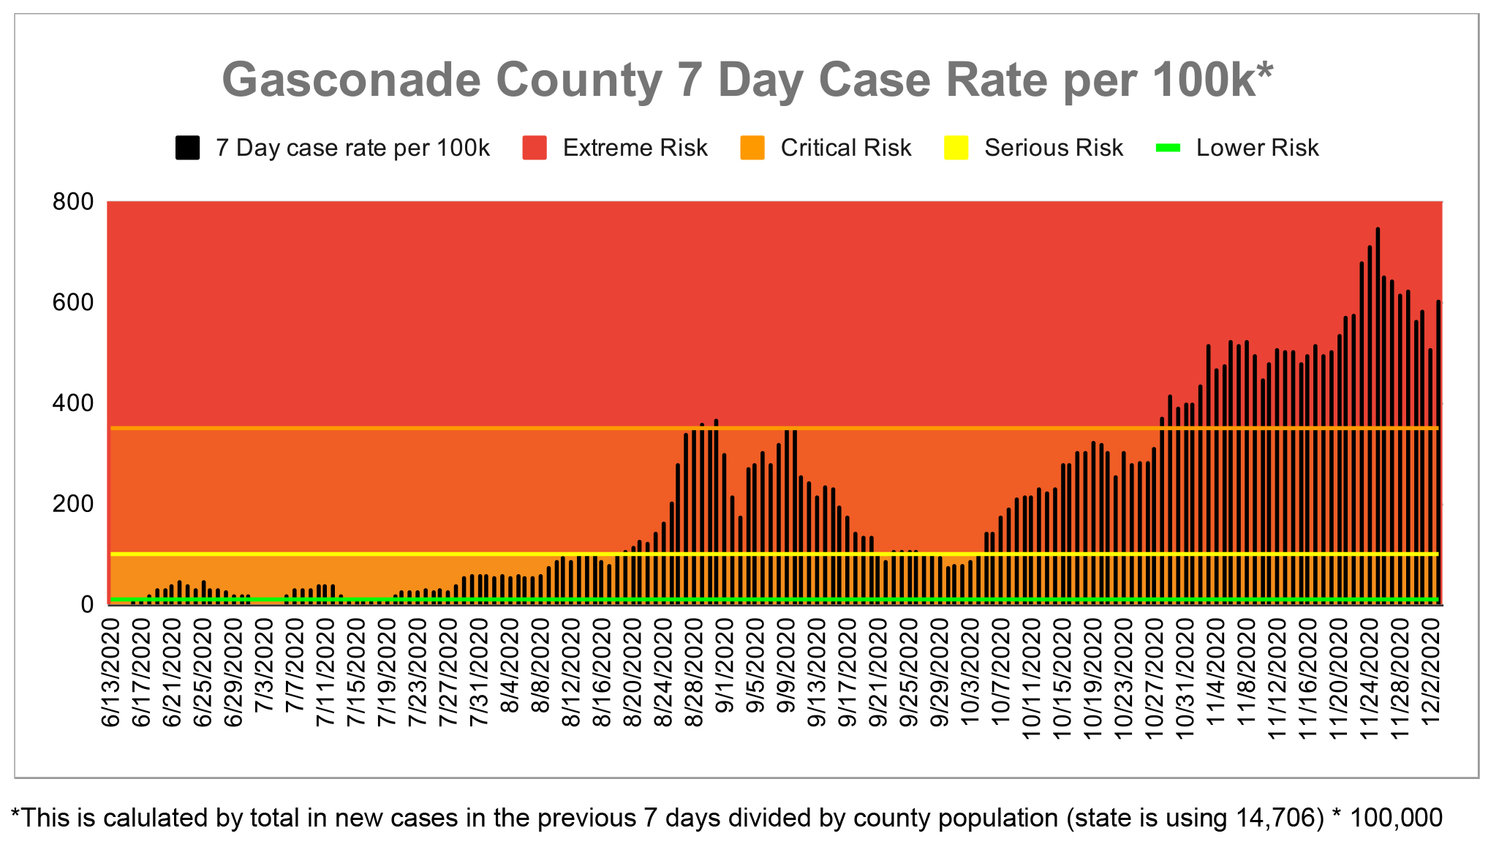
I feel the second graph is more important.
The “7 Day Case Rate per 100K” graph answers the question of: “how many new cases are being diagnosed each week?”
Here, there is also some good news.
After peaking at nearly 750 new cases per 100K/7 days during the week of Thanksgiving, new cases have dropped some, to just over 600 new cases per 100K.
As a reminder, the reason it is important to measure cases per 100K, is so we can compare our rate of new cases to other counties, the state as a whole or even the country.
However, while improved, our case rate is still nearly double the most dangerous category the governor identified (which is a 7-day case rate greater than 350/per 100K).
For those struggling to wrap their heads around rates per 100K, during the week of Thanksgiving, our rate peaked at 110 new cases per week in Gasconade County and is now down to 89 cases per week.
However, in order to drop out of the governor’s “Extreme Risk” category, our county would need less than 51 new cases in a week, and to drop below “Critical Risk,” we would need 14 or fewer new cases per week.